You can try your luck to make a fortune if you venture into trading cryptocurrency but make sure to add some risk management in your trades as you are not only dealing with human traders but "bots" as well.
Always DYOR on any coin you wish to trade and at least take a look at its historical chart how far does it managed to create its highs and lows for the past 5 to 10 years.
If it's a new coin in the blockchain then check updates on its developement and usecase if the developers are still active and keen to make the project going.
Here's just an idea to get you started in Trading Cryptocurrency
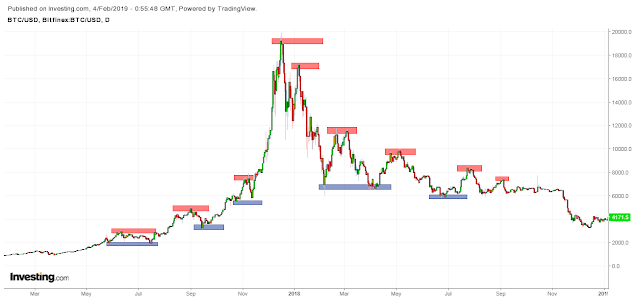
PRICE ACTIONS
To help you visualize further here's a sample chart➤blue color=support (buy)
Support where buyers come together pushing the "price up" and Resistance where sellers overwhelm buyers pushing the "price down".
Now you can either use a Daily time frame, Weekly, 5 minutes, 30 minutes time frame or other time frames that you may be comfortable with to find your own S&R levels.
It's up to you as there are no fix rules on how you will use charts to outsmart other traders.
It's up to you as there are no fix rules on how you will use charts to outsmart other traders.
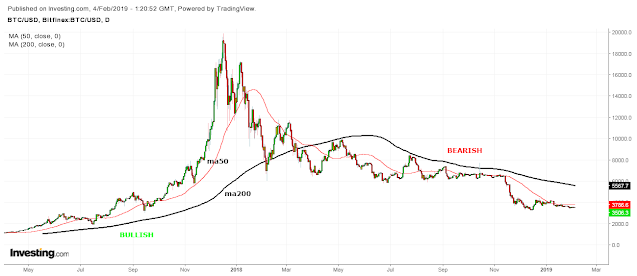
MOVING AVERAGES (MA50 & MA200)
Add two moving average and change its value to 50 and 200 respectively plus you may play around its color and line thickness to distinguish one from the other. |
| investing.com |
The moment those moving averages positioned below your prices simply means the sentiment of traders/investors in the market are very bullish.
Whereas if the moving average 50 starts to stay above your prices and fails to recover even with the moving average 200 still below the prices already signals that the market is losing its momentum.
Presented are just your guides (quick demo) as they are not guarantees it will still depend on how each will react every trading day, some may feel to sell their coins earlier or others would be aggressive on buying.
It's simply a "supply & demand" that will move the price up or down so don't rely too much on what you see on your charts but just a quick reference for you to decide on what side of the market will you be speculating on.
What you see from your charts are just pure records of the past/previous trading day and the chart will not tell you on the next price the following day.
What you see from your charts are just pure records of the past/previous trading day and the chart will not tell you on the next price the following day.
RISK MANAGEMENT
This is the most crucial part and you must learn how to apply "cut loss" as early as possible when the market is against your open position to minimize losses and have the patience to wait for another support to get back into the trade.
Found this post helpful?
Feel free to drop your comments below and share this to your friends.


0 Comments